- Original Paper
- Open access
- Published:
Clinical and pathological staging of the cancer at the nanoscale
Cancer Nanotechnology volume 3, pages 37–46 (2012)
Abstract
Clinical staging model at the nanoscale (CSMN) has been performed on adenocarcinoma of the colon from five patients ranging in age from 57 to 76 years based on determining their malignant size, estimating their doubling time through imaging techniques, and thus by measuring the average of the tumor nanoparticle doubling time their histologic grade has been identified at the nanoscale. Another two pathologic staging models at the nanoscale PSM [H-3] N and PSM [C-14] N for evaluating the histologic grade have been performed on those tumors based on the in vitro measuring of cell proliferating of tumor slices by either of the [H-3] tritiated and [C-14] thymidine incorporation hypothesizing in PSM [H-3] N that the malignant fraction of the detected tumor is the unlabeled fraction of the tumor by the [H-3] tritiated thymidine, while positing in PSM [C-14] N that the percentage increase of the tumor nanoparticle doubling time than that of the normal tissue at the Natural Background Radiation is equivalent to the percentage deficit of [C-14] incorporation in tumor cells. The consistency of results of the three staging models has been analyzed using ANOVA. Identical histologic grades have been identified by the three staging models for tumors of early stages (p < 0.0001). While for those of advanced disease, evaluation of the histologic grade was identical by CSMN and PSM [H-3] N only (p < 0.0001), whereas was invalid by PSM [C-14] N.
1 Introduction
Staging of cancer is the main objective of cancer screening, and considered the most important predictor of survival, where cancer treatment is primarily determined by staging which can be changed according to progression of the disease. There are two types for cancer staging, clinical and pathologic, where both are considered a supplement for each other (Lucas 2006), each of them describes the anatomic extent of the cancer at the time of diagnosis before the application of definitive treatment to develop classification into stages, which serves for treatment guidance and for comparing with the end results of the applied treatment (Wilson and Jungner 1968). Clinical stage is based on all of the available information obtained before a surgery to remove the tumor, while pathologic stage adds additional information gained by examination of the tumor microscopically after surgery expressing the stage before therapy only (Lucas 2006). Usually, cancer staging by either type expresses the extent that cancer has spread, and is usually described by numbers I to IV with IV having more progression. Such classification, which is well known by the TNM system, involves the tumor size (T) and the regional lymph node involvement (N) and/or distant metastasis (M), is based on the premise that cancers of the same histology and anatomic sites share similar patterns of growth and metastasis (AJCC 1998). Thereby, staging by those numbers which reflect the histologic grade is considered very wide and unspecified to describe the extent and aggressiveness of the disease in patients, allowing to either of over or lower estimation to the administered dose that contributes to risks of tumor regrowth and metastasis (Moawad 2011). E. Moawad has introduced a clinical staging by imaging techniques that allow accurate cancer staging that helps to administer the appropriate low-waste dose and modify it by monitoring an earlier response to therapy which contributes besides developing dose-delivery skills to the success of all types of cancer treatments (Moawad 2010, 2011). In the same time, it was possible to correlate the in vitro data with patient response to therapy and the incorporation of [3H] tritiated thymidine and the [14C] thymidine by slices of their tumors (Baserga and Lisco 1963; Wimber and Quastler 1963). No responses to therapy were found in those patients whose tumors when incubated in vitro with thymidine showed poor nucleoside incorporation. In contrast, patients receiving benefit from cancer therapy were those whose tumors when incubated in vitro with thymidine showed good nucleoside incorporation (Wolberg and Brown 1962). Such great variability reflects their variability in growth rate propensity for metastasis, or in other words, in their stages and consequently their corresponding grades. Thus, pathological staging has been assessed on the basis of measurements of the incorporation of [3H] tritiated thymidine and the [14C] thymidine in vitro in the tumor slices. Current approach aims to present clinical and pathological staging models of the cancer at the nanoscale to obtain more accurate assessment for the main factors of the prognostic determinants in the classification for cancer staging.
Clinical staging model at the nanoscale (CSMN)
E. Moawad has presented a clinical model for cancer grading in which the patient-specific histologic grade has been identified by evaluating the tumor energy (ETumor) based on measuring tumor doubling time (tD) which expresses the rate of growth by imaging techniques (Moawad 2010, 2011), and estimating the percentage of the hypoxic cells (H%) which expresses the tumor histologic classification, and inversely proportional to the total number of the malignant cells of the tumor whose value is ranging between 8 and 20 % (Moawad 2010, 2011). Thus, the energy of the hypoxic cell (EHypoxic.cell) which expresses the histologic grade at the cellular level can be estimated from Emad formula after measuring the tumor tD as follows:


Thus, provided that patient-specific histologic grade (ETumor) is the summation of energies of all the tumor hypoxic cells (ΣEHypoxic.cell) then:

where M% is the percentage of the tumor malignant fraction, and C0 is the total number of tumor cells (Moawad 2010, 2011). Knowing that a tumor of 1 g converted into 109 ng contains 109 cells, it would be more convenient to express the tumor histologic grade by nanoscale as equivalent to the average growth energy of a tumor of 1 ng or one nanoparticle (Eng) investigating whether we can directly control matter on the molecular scale. Hereby, in all sections of the current approach the tumor cell will be expressed by the tumor nanoparticle, i.e., ECell = Eng. Thus, from Eq. 3, it can be deduced that

and consequently the average doubling time of the tumor nanoparticle would be equivalent to:

Thus, from Emad formula the histologic grade of the tumor nanoparticle would be:

Pathological staging model by [3H] tritiated thymidine at the nanoscale
Based on the in vitro measuring of cell proliferating of tumor slices by [3H] tritiated thymidine incorporation, current approach introduces another pathological model for cancer grading at the nanoscale (pathological staging model by [3H] tritiated thymidine at the nanoscale (PSM [3H] N)); as labeling of cells by [3H] tritiated thymidine has been commonly used as an indicator of the proliferative capacity of tumor cells (Lieb and Lisco 1966), conversely the unlabeled tumor fraction (U%) has been hypothesized by this model as an indicator for the inhibition to cell-proliferating rate. As inhibition to cell-proliferating rate accompanied by cell cycle arrest distinguishes the malignant cells from the normal ones, then the unlabeled tumor fraction (U%) can be considered the malignant tumor fraction (M%) that previously presented as one of the factors of the clinical staging shown in Eq. 3, i.e., U% = M%. Thus, such inhibition to cell-proliferating rate can be monitored by the deficit of [3H] tritiated thymidine incorporation in the tumor malignant cells, provided that energy of such deficit part (U%) of the thymidine dose is equivalent to the energy of the malignant fraction (M%) of that tumor and denoted by ETumor which expresses the patient-specific histologic grade. Accordingly, by knowing the percentage of the unlabeled cells (U%) of the tumor then:

on condition that U% < 1. Consequently, the patient-specific histologic grade at the nanoscale would be:

Pathological staging model by [14C] thymidine at the nanoscale
It is well known that in all cancer stages from early to advanced disease, cancer cells are known to have alterations in multiple cellular signaling pathways drives normal cell to carcinoma (Wu et al. 2009). One of the most important signals is the continuous deficit in cell proliferation rate accompanied by a progressive cell cycle arrest along those stages (Reiskin and Mendelsohn 1964). Significant efforts have been made to understand the kinetic analysis of cell proliferation that drives cancer development and progression (Allard et al. 2004). There is as yet little to distinguish the cancerous cell from a variety of normal cells which have also been analyzed (Reiskin and Mendelsohn 1964) as basis of such efforts. Since labeling of cells by [14C] thymidine is commonly used as well in vitro in measuring cell proliferation rate, where the incorporation of the [14C] thymidine into the dividing cells and the level of this incorporation is proportional to the amount of cell proliferation (Reszka et al. 2001). Thus, the second pathological staging model presented by current thesis (pathological staging model by [14C] thymidine at the nanoscale (PSM [14C] N)) posits that the inhibition to cell-proliferating rate due to all the genetic variations and the aberrant activations accompanied by cell cycle arrest that drive the normal cell to carcinoma induces a deficit of [14C] thymidine incorporation in the detected samples compared to the control one. Consequently, percentage of the deficit of [14C] thymidine incorporation (D%) in those samples compared to the control one is equivalent to the increase of the tumor nanoparticle tD, i.e., tD.ng compared also to the cell doubling time at the natural background radiation (tD.NBR) which is equal to 1.884220083 s (AJCC 1998), i.e.

on condition that D% < 1. And thus PSM [14C] N is valid for samples of nanoparticle doubling time less than twice that of normal tissue nanoparticles at the NBR, i.e., tD.ng < 2tD.NBR. Accordingly, the histologic grade of the detected samples at the nanoscale can be derived by Emad formula as follows:

Since the identified histologic grade (Eng) by those models shown in Eqs. 6, 8, and 10 should be identical, and as factors concerned in those models should confirm basis of the main factors assessment of the prognostic determinants in the classification for cancer staging by the TNM system. The objective of the current approach is to investigate the consistency of the results of those models to provide a clear-cut criterion for accepting or rejecting the hypotheses of those models.
2 Methods and materials
As conducted and described by Larry M. Lieb and Hermann Lisco (1966), adenocarcinomas of the colon from five patients ranging in age from 57 to 76 years were obtained immediately following tumor resection in the operating room. The in vitro uptake of [3H] tritiated thymidine by those tumors cells was studied. The tumors were incubated for 1 h at 37.5 ± 0.5 °C in a beaker containing 100 ml of Ringer’s solution and 100 μ Ci of [3H] tritiated thymidine (Schwarz Laboratories, Inc., Mt. Vernon, New York) with a specific activity of 3.0 Ci/mmole . The tumor doubling time (tD) has been estimated, total numbers of tumor cells (Co), and the percentages of labeled cells in each tumor were measured for all five tumors. At the same time as conducted and described by Reszka et al. (Reszka et al. 2001), the corresponding in vitro uptake of [14C] thymidine by those tumors cells was studied after incubation of 72 h, where the amount of [14C] thymidine (NEN, Boston, MA) for measuring cell proliferation rate for each sample was proportional to its number of cells. The amount of [14C] thymidine that used for measuring the largest tumor (25,838 cells) was 0.5 μ Ci, while the amounts used for other tumors has been proportionally decreased by ratio of their number of cells to that of the largest one. Data and results as shown by Larry M. Lieb and Hermann Lisco, and the amount of the used [14C] thymidine for each tumor according to its Co with respect to that of the largest tumor along with its corresponding in vitro uptake carried out by current approach are tabulated in Table 1 to cover all data required for determining factors of the prognostic determinants of the presented pathological and clinical staging models; PSM [3H] N, clinical staging model at the nanoscale (CSMN), and PSM [14C] N.
3 Results and analysis
The released energy of 100 μ Ci of [3H] tritiated thymidine (half-life time = 12.32 years, decay energy = 0.01859 MeV (Barbalace 1995a)) during the incubation of 1 h is equivalent to:

While the released energy of 0.5 μ Ci of [14C] thymidine that used for the largest tumor which is the first tumor (half-life time = 5,730 years, decay energy = 0.156 MeV (Barbalace 1995b)) during the incubation of 72 h is equivalent to:

Whereas, the amounts of the used [14C] thymidine for other tumors would be decreased by a ratio of their number of cells to number of cells of the largest tumor which is the first one.
-
1st tumor:
From Table 1 the percentage of labeled cells by [3H] tritiated thymidine and number of cells were 26.5 % and 25,838, respectively. Thus, U% = 100 − 26.5 = 73.5 %, from Eq. 7
 MeV. Consequently, from Eq. 8 the histologic grade (Eng) of first tumor according to the PSM [3H] N would be 9,583.4 MeV, which according to the CSMN through Eqs. 5 and 6 and by taking (U% = M%), corresponds to H% = 8.45 % and tD.ng = 2.369134131 s < 2 tD.NBR. While from Table 1, the amount of the used [14C] thymidine was 0.5 μ Ci, and the percentage of labeled cells by [14C] thymidine was 75.67 %. Thus, D% = 100 − 75.67 = 24.33 %, from Eq. 9tD.ng = 1.2433 tD.NBR = 2.3426474 s which is 99 % identical to what has been measured by CSMN. Consequently, from Eq. 10 the histologic grade of the first tumor according to the PSM [14C] N Eng would be 9,156.36 MeV which is 96 % identical to what has been measured by PSM [3H] N.
 -
2nd tumor:
From Table 1 the percentage of labeled cells by [3H] tritiated thymidine and number of cells were 20.2 % and 22,015, respectively. Thus, U% = 100 − 20.2 = 79.8 %, from Eq. 7
 MeV. Consequently, from Eq. 8 the histologic grade (Eng) of second tumor according to the PSM [3H] N would be 11,247.69 MeV, which according to the CSMN through Eqs. 5 and 6 and by taking (U% = M %), corresponds to H% = 9.8 % and tD.ng = 2.477723427 s < 2 tD.NBR. While from Table 1, the amount of the used [14C] thymidine was
  , and the percentage of labeled cells by [14C] thymidine was 69 %. Thus, D% = 100 − 69 = 31 %, from Eq. 9tD.ng = 1.31 tD.NBR = 2.46837259 s which is ≈100 % identical to what has been measured by CSMN. Consequently, from Eq. 10 the histologic grade of the second tumor according to the PSM [14C] N Eng would be 11,109.553 MeV which is ≈99 % identical to what has been measured by PSM [3H] N.
 -
3rd tumor:
From Table 1 the percentage of labeled cells by [3H] tritiated thymidine and number of cells were 10.9 % and 13,443, respectively. Thus, U% = 100 − 10.9 = 89.1 %, from Eq. 7
 MeV. Consequently, from Eq. 8 the histologic grade (Eng) of the third tumor according to the PSM [3H] N would be 18,419.84 MeV, which according to the CSMN through Eqs. 5 and 6 and by taking (U% = M%), corresponds to H% = 15.73 % and tD.ng = 3.064650384 s < 2 tD.NBR. While from Table 1, the amount of the used [14C] thymidine was
  , and the percentage of labeled cells by [14C] thymidine was 43.31 %. Thus, D% = 100 − 43.31 = 56.69 %, from Eq. 9tD.ng = 1.5669 tD.NBR = 2.952384449 s which is 96.34 % identical to what has been measured by CSMN. Consequently, from Eq. 10 the histologic grade of the third tumor according to the PSM [14C] N Eng would be 17,238.24 MeV which is 93.6 % identical to what has been measured by PSM [3H] N.
 -
4th tumor:
From Table 1 the percentage of labeled cells by [3H] tritiated thymidine and number of cells were 4.5 % and 9,800, respectively. Thus, U% = 100 − 4.5 = 95.5 %, from Eq. 7
 MeV. Consequently, from Eq. 8 the histologic grade (Eng) of fourth tumor according to the PSM [3H] N would be 25,267.14 MeV, which according to the CSMN through Eqs. 5 and 6 and by taking (U% = M %), corresponds to H% = 21.03 % and tD.ng = 3.880342339 s > 2 tD.NBR. Accordingly, PSM [14C] N is not valid to evaluate the fourth tumor as tD.ng > 2tD.NBR as postulated in PSM [14C] N.
 -
5th tumor:
From Table 1 the percentage of labeled cells by [3H] tritiated thymidine and number of cells were15.4 % and 9,605, respectively. Thus, U% = 100 − 15.4 = 84.6 %, from Eq. 7
 . Consequently, from Eq. 8 the histologic grade (Eng) of the fifth tumor according to the PSM [3H] N would be 25,780.11 MeV, which according to the CSMN through Eqs. 5 and 6 and by taking (U% = M%), corresponds to H% = 22.2356 % and tD.ng = 3.955245085 s > 2 tD.NBR. Accordingly, PSM [14C] N is not valid to evaluate the fifth tumor as tD.ng > 2 tD.NBR as postulated in PSM [14C] N. But if such hypothesis for PSM [14C] N validity has been ignored, accuracy of PSM [14C] N would be decreased with respect to the accuracy of each of PSM [3H] N and CSMN as much as tD.ng increases more than twice tD.NBR as follows: For the fourth tumor, the amount of the used [14C] thymidine as shown in Table 1 is
  , and the percentage of labeled cells by [14C] thymidine was 16.65 %. Thus, D% = 100 − 16.65 = 83.35 %, from Eq. 9tD.ng = 1.8335 tD.NBR = 3.454652815 s which is 89 % identical to what has been measured by CSMN. Consequently, from Eq. 10 the histologic grade of fifth tumor according to the PSM [14C] N Eng would be 22,021.41 MeV which is 87.15 % identical to what has been measured by PSM [3H] N. While for fifth tumor, the amount of the used [14C] thymidine as shown in Table 1 is
  , and the percentage of labeled cells by [14C] thymidine was 24.67 %. Thus, D% = 100 − 24.67 = 75.33 %, from Eq. 9tD.ng = 1.7533 tD.NBR = 3.303653538 s which is 93 % identical to what has been measured by CSMN. Consequently, from Eq. 10 the histologic grade of fifth tumor according to the PSM [14C] N Eng would be 20,710.1 MeV which is 80.33 % identical to what has been measured by PSM [3H] N. The results of the physical analysis to the in vitro uptake of tritiated thymidine by the 5 tumors are shown in table 2, where the consistency of the results of the three staging models has been analyzed using ANOVA (Table 2). The relation of the derived values of H% from CSMN which represents the histologic classification and the measured values of Eng from PSM [3H] N, which represents the histologic grade at the cellular level or at the nanoscale, shows perfect direct correlation (r = 0.9999) between them for all studied tumors as shown in Fig. 1. Thereby, H% can be estimated by the following equation model:
 (11)
(11)(R2 = 0.9998).
Fig. 1 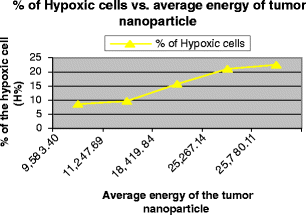
Percent of the hypoxic cells vs. average energy of the tumor nanoparticle
 MeV. Consequently, from Eq.
  MeV. Consequently, from Eq.
  , and the percentage of labeled cells by [14C] thymidine was 69 %. Thus, D% = 100 − 69 = 31 %, from Eq.
  MeV. Consequently, from Eq.
  , and the percentage of labeled cells by [14C] thymidine was 43.31 %. Thus, D% = 100 − 43.31 = 56.69 %, from Eq.
  MeV. Consequently, from Eq.
  . Consequently, from Eq.
  , and the percentage of labeled cells by [14C] thymidine was 16.65 %. Thus, D% = 100 − 16.65 = 83.35 %, from Eq.
  , and the percentage of labeled cells by [14C] thymidine was 24.67 %. Thus, D% = 100 − 24.67 = 75.33 %, from Eq.

While Fig. 2 shows the strong inverse correlation between percentages of the hypoxic cells (H) and their corresponding total number of tumor cells (C0) for the studied tumors (r = −0.98) as postulated in the mathematical model of the clinical staging, this indirect correlation decreases dramatically (r = −0.36) as much as the tumor size (C0) increases or decreases aggressively to confirm the postulated range of the percentage of the hypoxic cells (H) by the clinical model CSMN. At the same time, by knowing tumor tD and the corresponding values of ETumor, Eng from the pathological model PSM [3H] N, and then getting their predicted value of (H) derived from Eq. 11, and then substituting all these values in Eqs. 1 and 3 of the clinical model CSMN, the derived malignant tumor fraction (M%) would be identical to the unlabeled tumor fraction (U%) for all tumors as shown in Fig. 3 to confirm the hypothesis of PSM [3H] N about their equivalence (M% = U% (p < 0.0001)). Therefore, it can be easily concluded that the unlabeled fraction of tumor cells by the [3H] tritiated thymidine (U%) expresses the factor of the histologic classification in cancer staging and grading. By measuring the factor of cell proliferation rate in CSMN which is tumor tD, the relation of the derived values of EHypoxic.cell from Eq. 1 and the measured values of W from PSM [3H] N shows perfect direct correlation (r = 0.99) between them for all studied tumors as shown in Fig. 4. Thus, depending on the clinical model CSMN only, tumor evaluation can be performed by estimating M% and H% as follows:

as previously shown by E. Moawad (2010, 2011). And conversely by measuring the factor of histologic classification in PSM [3H] N which is U, the factor of the histologic grade of the hypoxic cell in CSMN which is EHypoxic.cell can be estimated by the following equation model:

while this equation is not valid for U < 100. Whereas, from Eqs. 3, 4, and 11, it can be deduced the strong direct correlation (r = 0.9999) as well between H% and their corresponding ( ) as shown in Fig. 5, then H% can be estimated by the following equation model:

(R2 = 0.99), when  , while for less values than the lower limit of this interval, which represents validity of CSMN, the best estimate of H% is 10 % as previously estimated in prior studies (AJCC 1998; Baserga and Lisco 1963). Accuracy of PSM [14C] N in evaluating the tumors of the earlier stages of lower percentage of hypoxic cells as illustrated in the first three cases shown in Fig. 6 confirms the hypothesis of PSM [14C] N for the equivalence of the percentage of the deficit part of [14C] thymidine incorporation (D%) in tumor of earlier stage compared to the control tissue and the percentage of the increase of the tumor nanoparticle doubling time (tD.ng) at earlier stages than that of the normal counterpart at the natural background radiation (tD.NBR) (tD.ng = (1+D%) × tD.NBR) (p < 0.0001). While such accuracy of PSM [14C] N in evaluating the tumors of advanced disease (higher percentage of hypoxic cells) is less than that of the earlier stages as illustrated in the last two cases shown in Fig. 6 which is consistent with its validity condition (D% < 1 or tD.ng < 2 tD.NBR). Thereby, it can be easily concluded that the fraction of the deficit part of [14C] thymidine incorporation (D%) in tumor compared to the control tissue at the NBR expresses the factor of the cell proliferation rate in cancer staging and grading. The identical evaluation of the histologic grades for the first three detected tumors of relatively earlier stages by the PSM [3H] N, CSMN, and PSM [14C] N (p < 0.0001) boost the confidence to accept the hypotheses of those models and to comply with the basis of the main factors assessment of the prognostic determinants in the classification for cancer staging by the TNM system.

Percent of the hypoxic cells vs. number of cells

Conformity of the percent unlabeled fraction of tumor by tritiated thymidine and the malignant fraction in each tumor

Percent of unlabeled (malignant) fraction of tumor cells U% vs. energy of the hypoxic cell EHypoxic:cell

Percent of the hypoxic cells vs. [EH (MeV)/(M% × C0)]

Identical results of CSMN, PSM [H-3] N, and PSM [C-14] N in evaluating tumors of earlier stages, while those of advanced stages CSMN, PSM [H-3] N are more efficient
4 Discussion
Although, variations in tumor response to cancer therapies have been observed frequently by clinicians in patients of tumors have been identified by same stage and degree, so that those tumors appeared identical by all gross and histological parameters according to the TNM system. In some, the tumors may respond effectively, whereas in the others the tumors are unaffected by the drug and rapidly disseminate and kill them (Wolberg and Brown 1962). Such variations have led latter to believe that dosimetry never inherits identical results! (Matthay KK 2001). Recently, E. Moawad has attributed such random variations to the wide and insufficient staging by the TNM system that leads to dose assessment using standard models and consequently to a wide range of doses, responsible for tumor regrowth and second cancer risks (Moawad 2010, 2011). And emphasized that tumor growth rate is a major factor should be considered in cancer staging to target a patient-specific histologic grade and consequently a patient-specific appropriate dose (Moawad 2010, 2011). Thus, patient-specific histologic grade is the main objective of the advanced cancer staging and considered the most important predictor of survival, where cancer treatment is primarily determined according to it. As cancer staging by either of the clinical or pathological type should conform to each other to strengthen the confidence to both types, then basis for staging by either type should be assessed on identifying the factors of the prognostic determinants for the histologic classification and the anatomic extent of the cancer that lead to identical histologic grade identified by either type for the same tumor. According to the TNM system, the factors of the staging that should be considered focus on tumor location, size, rate of growth, histologic classification, and the anatomic extent which the disease has spread (AJCC 1998). Those different factors measured by both types of staging should be linked together such that from clinical measurements, the pathologic ones can be predicted and vice versa. The goal of this study is to present models of clinical and pathological staging of the cancer at the nanoscale parallel and comply with what is applied and achieved in the staging by the TNM system. Recently, rate of cell proliferation has been expressed using Emad formula by cell growth energy (CGE) which is the amount of energy of all cellular kinetics including all the aberrant genetic variations that drive normal cell to cancer (Moawad 2010, 2011). Thus, the progress through measuring cellular kinetics allowed the improvement of the factors of the clinical model CSMN as (EHypoxic.cell, tDng, and Eng) to distinguish the normal tissue from the cancerous one which must be given prime consideration in evaluating and comparing different therapeutic regimens. For the pathological models PSM [3H] N and PSM [14C] N, [3H] tritiated thymidine and [14C] thymidine are commonly used in vitro in cell proliferation assays, where both are incorporated into dividing cells and the level of this incorporation, measured using a liquid scintillation counter, is proportional to the amount of cell proliferation (Reszka et al. 2001). It was possible to correlate the in vitro data with patient response to therapy and the incorporation of [14C] thymidine and [3H] tritiated thymidine by slices of their tumors. No responses to therapy were found in those patients whose tumors when incubated in vitro with either of them showed poor nucleoside incorporation. In contrast, patients receiving benefit from cancer therapy were those whose tumors when incubated in vitro with either of them showed good nucleoside incorporation (Wolberg and Brown 1962). The latter have attributed the considerable variation in the percentage of labeled cells by either of [14C] and [3H] tritiated thymidine that indicates cell proliferating for similar histological cancerous tissues to errors in the technique. While such great variability have been attributed by those presented models to tumors variability in growth rate (tD) propensity for metastasis, or in other words, to the specific patient stages and consequently their corresponding grades. The anatomic extent to which the disease has spread is no longer the most important factor determining prognosis. The added factors considered in the clinical model CSMN are (1) the tumor doubling time (tD) which expresses the cell proliferative rate of the hypoxic cell and is considered an indicator for the amount of inhibition to cell growth. The longer the tD of the tumor the more tumor hypoxic cell cycle arrest accompanied by aberrant genetic variations drive normal cell to carcinoma. Energy drives those aberrant genetic variations in the hypoxic cell (EHypoxic.cell) can be estimated using Emad formula by knowing the tumor tD as shown in Eq. 1. While (ΣEHypoxic.cell) constitutes nearly the entire energy of the malignant tumor fraction (ETumor) which considered the specific tumor histologic grade (Moawad 2010, 2011). (2) Consequently, percentage of the hypoxic cell (H%) which represents the histologic classification should be considered in cancer staging. The consistent results of the perfect correlation between H% and their corresponding averages of energy of the tumor nanoparticle (Eng) revealed that accurate histologic diagnosis is essential element in the specific evaluation of the tumor to confirm the basis of the main factors assessment of the prognostic determinants in the classification for cancer staging by the TNM system. In addition, the significant effect of H% on identifying the specific histologic grade is consistent with what has been noted by others that the extent of labeling of tumor cells by [3H] tritiated thymidine in an in vitro system is dependent upon the oxygen concentration, the type and number of cells composing the tissue, and any fissuring or cracking of the tissue which might allow deeper penetration of the incubation fluid (Johnson and Bond 1961). Such note reveals the role of hypoxic cells in inhibition to cell labeling (i.e., to increase U% which expresses the increase of M% as well) by thymidine incorporation as it is believed that cell hypoxia contributes significantly to treatment failure because cells in the hypoxic zones resist traditional chemical disinfection. This happens for at least two reasons: First, most agents cannot penetrate beyond 50–100 μm from capillaries (Minchinton and Tannock 2006), therefore never reaching the cells in the hypoxic regions. Second, the lower nutrient and oxygen supply to cells in the hypoxic zones causes them to divide more slowly, i.e., longer cell tD than their well-oxygenated counterparts. Therefore and in agreement with Emad formula shown in Eq. 1, the hypoxic cells due to its higher CGE exhibit greater resistance to chemical treatments, radiation, and thus serve to inhibit thymidine incorporation that targets rapidly dividing cells or requires oxygen for efficacy (Gillies and Gatenby 2007; Sullivan and Graham 2007; Brown 1999; Castello and David 2006). (3) The malignant tumor fraction (M%) which is a dependent factor for cancer staging depends on the tumor tD and consequently the EHypoxic.cell as shown in Table 1, thus it was taken in consideration the values of EHypoxic.cell, and tD to estimate M% as shown in Eq. 12. While the unique factor concerned in the pathological model PSM [3H] N is the unlabeled tumor fraction by the [3H] tritiated thymidine (U%), which has been hypothesized to be equivalent to M%. Perfect correlations between cancer staging factors of the clinical model CSMN and the pathological one, PSM [3H] N (EHypoxic.cell, U% and Eng, H%) confirms, provides a clear-cut criterion for accepting the hypotheses of both models for staging of cancer and strengthens the confidence as well in the equivalence of the energy of the unlabeled fraction of the tumor cells (U%) by the [3H] tritiated thymidine to that of the malignant fraction (M%) of the detected tumor (U = M; p < 0.0001) as hypothesized by PSM [3H] N and shown in Fig. 3. While the unique factor concerned in the pathological model PSM [14C] N is the percentage of the deficit of [14C] thymidine incorporation (D%) in the detected samples compared to the control one at the NBR. D% was identical as hypothesized by PSM [14C] N to the percentage average increase of tumor nanoparticle doubling time than that of the normal tissue at the NBR measured by either the clinical model CSMN or the pathological one (PSM [3H] N; p < 0.0001), which provide as well a clear-cut criterion for accepting the hypothesis of the pathological model (PSM [14C] N) for staging the cancer. Also, the identical specific histologic grades at the nanoscale (Eng) for the tumors of earlier stages evaluated by CSMN, PSM [3H] N, and PSM [14C] N leaving no room for doubt to accept staging and grading of the earlier stages of cancer by all those models. Validity of the pathological model PSM [3H] N extends as long as tumor energy is lower than that of the [3H] tritiated thymidine irrespective to their difference, such condition is satisfied whenever U% < 100 %. The more such difference in favor of [3H] tritiated thymidine energy the lower the proportion of the unlabeled tumor fraction, and conversely the derived H% from Eq. 14 would be correspondingly increased, thus consistency of the estimated histologic grade by either PSM [3H] N or CSMN are not affected by the increase in magnitude of energy of the [3H] tritiated thymidine dose. While the validity of PSM [14C] N extends as long as the detected tumor nanoparticle doubling time is less than twice that of the normal nanoparticle at the NBR. Thereby, as PSM [14C] N considers cell proliferation rate only, PSM [14C] N is less efficient in evaluating tumors of advanced stages for their higher cell proliferation rate inhibition, while CSMN and PSM [3H] N are more efficient in evaluating the tumors of advanced stages as those models consider the histologic classification as previously shown in Section 3 besides the cell proliferation rate. The main principal finding has emerged from this study was the wide variation shown in M% and the wide variation in the labeling index among the five cases so that Larry M. Lieb and Hermann Lisco noted that “Our data provide no explanation for such variations” (Lieb and Lisco 1966). The consistent results of the current approach provide such explanation: as tD varies among the five cases, their corresponding EHypoxic.cell varies as well and consequently the unlabeled fraction of each fraction (U% = M%) as shown in Eq. 12. Results of the current approach are consistent with the results of models shown in the previous studies taking into consideration that the value of (M%) was 100 % in those prior studied cases as EHypoxic.cell was greater than 5.2 Emad to satisfy the restriction of Eq. 12 (Moawad 2010, 2011). The classification by the TNM system achieves reasonably precise description and recording of the anatomic extent of cancer, it allows patients of different histologic grades to be diagnosed by same stage, and consequently receive same treatment, and therefore, it is not surprising to find such random variations in responses of those patients to their unspecified treatment. Thus, the objective of those models which is the patient histologic grade is a combination of the stage groupings of the T, N, and M classifications in a specific-patient prognosis to provide a simple way by which this information can readily assist in choices of treatments and therapeutic decisions, and thus those models will erase the blame for non-matching results of the dosimetry.
5 Conclusion
CSMN, PSM [3H] N, and PSM [14C] N introduce innovative solutions to improve identification of effective diagnostic tool based on an individual’s unique tumor well-tolerated with acceptably low rates of false positive and false negative results to establish an efficient cancer screening by a reasonable classification for staging of cancer. The anatomic extent to which the disease has spread is no longer alone the most important factor determining prognosis in the classification for cancer staging. The tumor doubling time and the histologic classification are the prognostic determinants to identify the specific tumor histologic grade at the nanoscale which is the most important variable that affects choices and allows physicians to develop customized treatment plans for patients.
Models that consider each of cell proliferation rate and the histologic classification as CSMN and PSM [3H] N are more efficient than the ones that consider the cell proliferation rate only as PSM [14C] N in evaluating the histologic grade of tumors of advanced stages.
References
AJCC Cancer Staging Handbook: For the AJCC Cancer Staging Manual by Irvin D. Fleming (Feb 1998)
Allard WJ, Matera J, Miller MC et al (2004) Tumor cells circulate in the peripheral blood of all major carcinomas but not in healthy subjects or patients with nonmalignant diseases. Clin Cancer Res 10(20):6897–6904
Barbalace K (1995–2011) Periodic table of elements—H—hydrogen. EnvironmentalChemistry.com. Accessed on-line: 12/21/2011 http://EnvironmentalChemistry.com/yogi/periodic/H-pg2.html
Barbalace K (1995–2012) Periodic table of elements—C—carbon. EnvironmentalChemistry.com. Accessed on-line: 1/12/2012 http://EnvironmentalChemistry.com/yogi/periodic/C-pg2.html
Baserga R, Lisco E (1963) Duration of DNA synthesis in Ehrlich ascites cells as estimated by double-labeling with C14and H3-thymidine and autoradiography. J Natl Cancer Inst 31:1559–1571
Brown JM (1999) The hypoxic cell: a target for selective cancer therapy—eighteenth Bruce F. Cain Memorial Award lecture. Cancer Res 59:5863–5870
Castello PR, David PS (2006) Mitochondrial cytochrome oxidase produces nitric oxide under hypoxic conditions: implications for oxygen sensing and hypoxic signaling in eukaryotes. Cell Metab 3:277–287
Gillies RJ, Gatenby RA (2007) Hypoxia and adaptive landscapes in the evolution of carcinogenesis. Cancer Metastasis Rev 26:1573
Johnson HA, Bond VP (1961) A method of labeling tissues with tritiated thymidine in vitro and its use in comparing rates of cell proliferation in duct epithelium, fibroadenoma, and carcinoma of human breast. Cancer 14:639–643
Lieb LM, Lisco H (1966) In vitro uptake of tritiated thymidine by carcinoma of the human colon. Cancer Res 26:733–740
Lucas E (2006-01-31) “FIGO staging of cervical carcinomas”. Screening.iarc.fr. http://screening.iarc.fr/viaviliappendix1.php. Retrieved 2010-10-14
Matthay KK, Panina C, Huberty J, et al (2001) Correlation of tumor and whole-body dosimetry with tumor response and toxicity in refractory neuroblastoma treated with 131I-MIBG. J Nucl Med 42:1713–1721
Minchinton A, Tannock I (2006) Drug penetration in solid tumors. Nat Rev Cancer 6:583–592
Moawad E (2010) Isolated system towards a successful radiotherapy treatment. Nucl Med Mol Imaging 44:123–136
Moawad EY (2011) Radiotherapy and risks of tumor regrowth or inducing second cancer. Cancer Nanotechnol 2:81–93
Reiskin AB, Mendelsohn ML (1964) A comparison of the cell cycle in induced carcinomas and their normal counterpart. Cancer Res 24:1131–1136
Reszka AA et al (2001) Nitrogen-bisphosphonates block retinoblastoma phosphorylation and cell growth by inhibiting the cholesterol biosynthetic pathway in a keratinocyte model for esophageal irritation. Mol Pharmacol 59:193–202
Sullivan R, Graham CH (2007) Hypoxia-driven selection of the metastatic phenotype. Cancer Metastasis Rev 26:319–331
Wilson JMG, Jungner G (1968) Principles and practice of screening for disease. World Health Organization, Geneva, Public Health Papers, #34
Wimber DE, Quastler H (1963) A C14-and H3-thymidine double labeling technique in the study of cell proliferation in Tnadescantia root tips. Exp Cell Res 30:8–22
Wolberg WH, Brown RR (1962) Autoradiographic studies of in vitro incorporation of uridine and thymidine by human tumor tissue. Cancer Res 22:1113–1119
Wu C-J, Cai T, Rikova K, Merberg D, Kasif S et al (2009) A predictive phosphorylation signature of lung cancer. PLoS One 4(11):e7994. doi:10.1371/journal.pone.0007994
Conflict of interest
The author declares that there is no conflict of interest concerning this paper.
Author information
Authors and Affiliations
Corresponding author
Additional information
“A member of the Korean Society of Nuclear Medicine and a member of the American Organisation of Interventional Oncology (IO)”
Rights and permissions
Open Access This article is distributed under the terms of the Creative Commons Attribution 2.0 International License ( https://creativecommons.org/licenses/by/2.0 ), which permits unrestricted use, distribution, and reproduction in any medium, provided the original work is properly cited.
About this article
Cite this article
Moawad, E.Y. Clinical and pathological staging of the cancer at the nanoscale. Cancer Nano 3, 37–46 (2012). https://doi.org/10.1007/s12645-012-0028-x
Received:
Accepted:
Published:
Issue Date:
DOI: https://doi.org/10.1007/s12645-012-0028-x